A product infographic is a call-out graphic that gives extra product information. On Amazon, it appears in the second or third image position of a listing. In furniture and home goods listings, this image lets customers know if the doors are soft closing, the desk base is made from 16 gauge steel, or the tiles are frost-proof, without needing to touch the product. It answers the questions a customer would otherwise ask in a physical store.
After the main image, these are the images with the most rules to follow. Amazon allows text in the additional image slots, but the text cannot include reviews, star ratings or Amazon badges. Walmart does not allow promotional claims on any image. They must also be readable on mobile devices.
Here are the different styles of product infographics that work for furniture and home brands, the rules for using them on Amazon, how to make them readable on mobile devices, and why an increasing number of brands are making them from 3D renders. This guide is based on our work as an Amazon-certified 3D content provider.
What Is a Product Infographic?
A product infographic is a render or photograph with information added on top. This includes call-outs, icons, measurements and brief text. The image shows the product, and the graphics highlight the key features for the customer.
In marketplace listings, product infographics appear in the image gallery. The main image will be a clean view of the product, and on Amazon no text is allowed in the main image. Further down the page, A+ Content displays brand information using modules of images and text. Product infographics appear in between, in the gallery, which is where customers look first.
Research from Baymard Institute’s product page usability testing shows that 56% of users looked at product images first, even when the information they needed was in the description. The same study found that 52% of sites did not add any descriptive text or graphics to the images of their top selling products. If the information a customer is looking for isn’t in the image gallery, they may miss a product that suits them.
Types of Product Infographics
Most product infographics fall into one of 6 common formats. Each one answers a different question, so a good listing usually uses a combination of 2 or 3.
| Type | Question it answers | Works best for |
|---|---|---|
| Feature callouts on white | What does it do? | Storage, mechanisms, adjustable parts |
| Callouts in a room scene | How does it work in my space? | Desks, outdoor furniture, lighting |
| Layer infographic | What’s inside? | Mattresses, cushions, flooring, textiles |
| Construction cutaway | How is it built? | Upholstered and reclining seating, cabinets |
| Spec and dimension infographic | Will it fit and last? | Tiles, rugs, building materials, anything sold by size |
| Feature icon row | What properties does it have? | Rugs, outdoor fabrics, anything with invisible benefits |
Feature Callouts on White
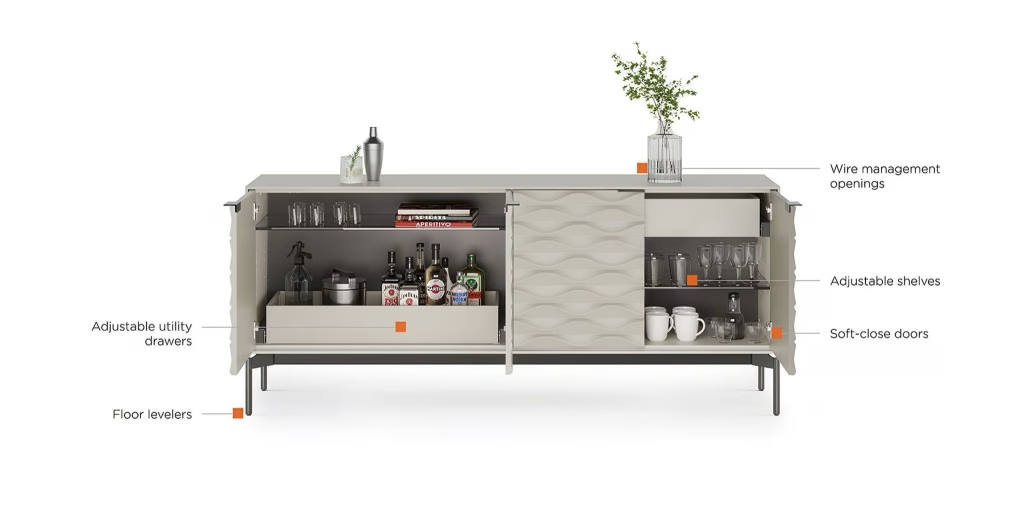
This is the classic Amazon infographic: a clean white or light background, with thin lines pointing from each feature to brief text. This graphic works best with products that have hidden features, such as storage, mechanisms and adjustments. For case goods, it is best to show the product open. If the credenza doors are closed, it is impossible to show adjustable shelving and utility drawers. As such, the doors are displayed open and the call-outs point inside. A few items on the shelves are acceptable in this image to show the capacity.
Callouts in a Room Scene
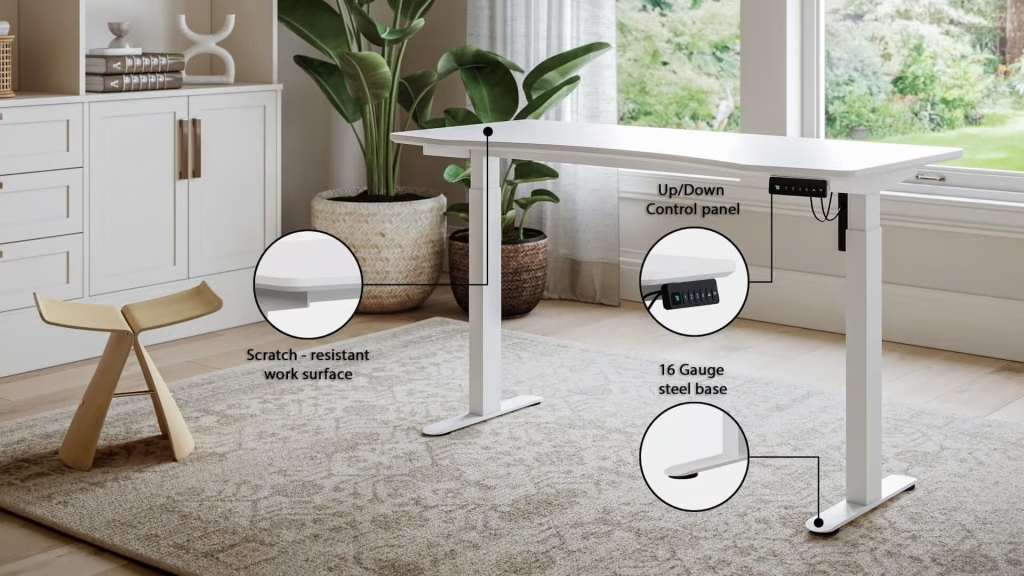
If the setting helps to sell the product, add call-out text to a lifestyle scene. If parts of the product are too small to read in context, add a magnified circle, so the control panel or base plate stays clear while the customer still sees the whole desk in a home office. In lifestyle scenes, use 3 or 4 call-outs at most, as the room itself already competes for attention.
Layer Infographics
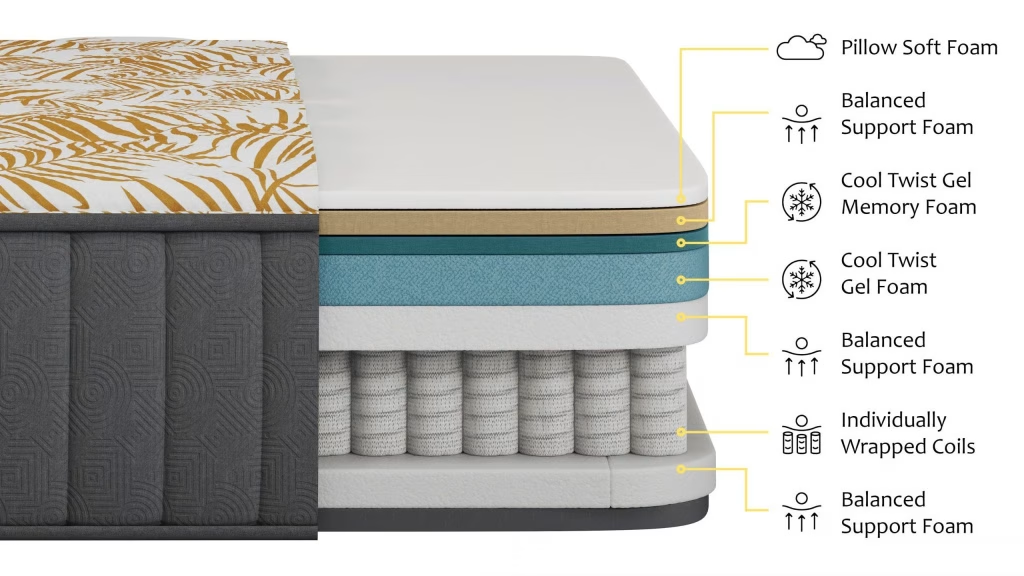
Some products sell on what is inside. A layer infographic peels back the product to show its internal components, with a label and icon for each layer. This is important for products such as mattresses, cushions, flooring and multi-layered textiles, as the inside is exactly what a customer cannot check when buying online. Our guide to exploded view drawings and renders explains how these views are built.
Construction Cutaways
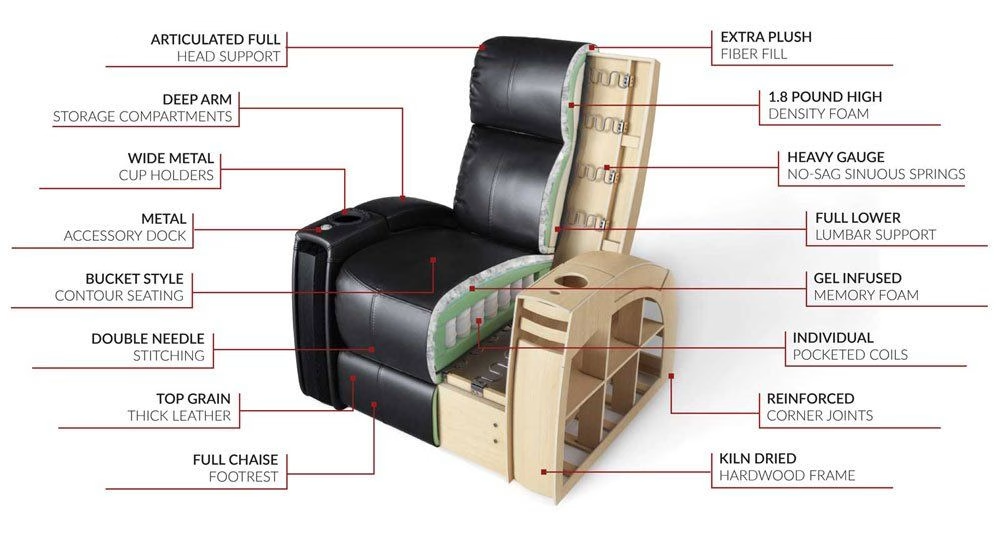
A cutaway removes a section of the outer shell to show the inner components. In a recliner, this could be the hardwood frame, sinuous springs and pocketed coils. These are the parts the customer pays for but never sees. With 16 labels in this image, it works best where the image is displayed large, such as on your own product page or in A+ Content. If you use it in the Amazon image gallery, split it into 2 or 3 images.
Spec and Dimension Infographics
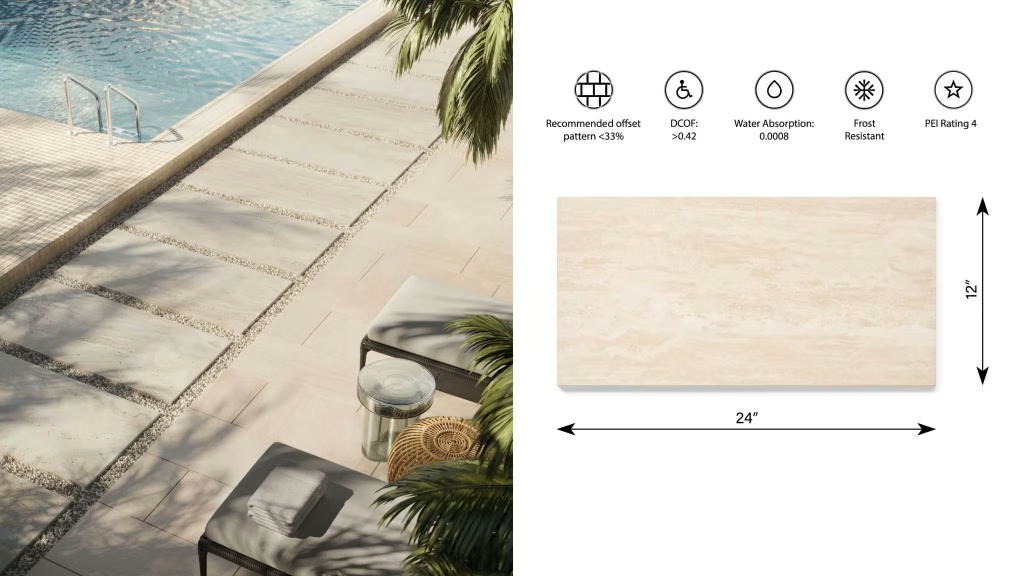
Technical properties such as slip resistance, water absorption or a PEI wear rating are abstract. A row of icons helps the customer scan this information quickly, and a dimension drawing answers the question of fit. The split layout above shows the specs next to an installed view, so the customer can see the technical information and the appearance in one image.
Feature Icon Rows
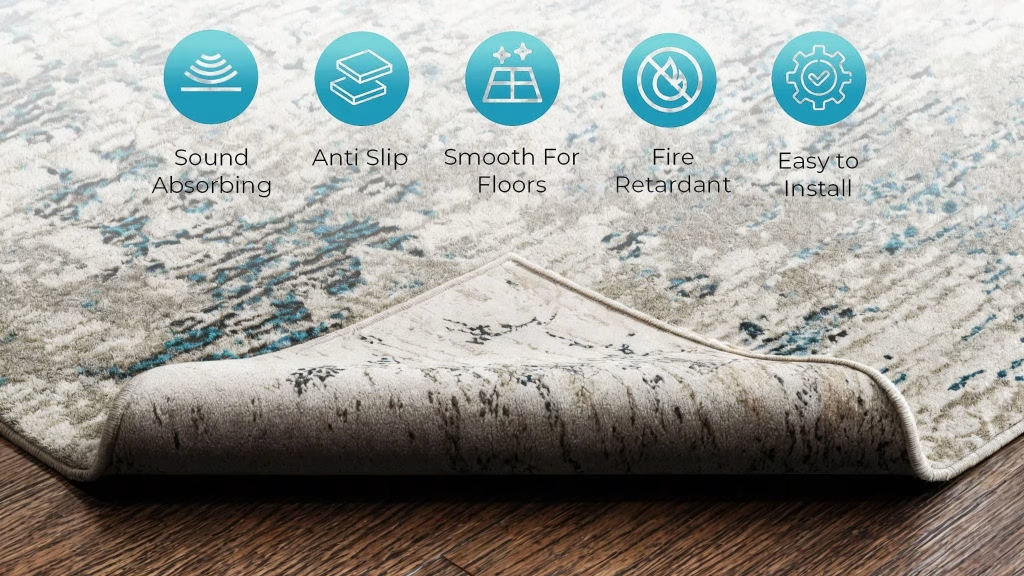
Some benefits cannot be seen in any picture. A rug cannot show on screen that it absorbs sound or grips a wooden floor, so each benefit gets an icon and 2 or 3 words of text over a close-up of the product. Turning over a corner to show the backing gives the anti-slip benefit something to stand on. Icons only work when they are consistent across the catalog, with the same shape, color and line weight on every product in the range.
Other simple infographics may be added to complete the set of images. These include dimensions in inches and centimeters, the contents of the box, a size or model comparison, and the full range of colors and finishes.
Amazon Infographic Rules
Although the term “infographic” is not mentioned in Amazon’s rules, its product image guide sets what can and cannot be included. In short, infographics are never allowed on the main image. They are free to use in the additional images, with some restrictions.
| Image slot | Code | Infographic allowed? |
|---|---|---|
| Main image | MAIN | No. Pure white background, only the product and included accessories |
| Additional images | PT01–PT99 | Yes. Callouts, dimensions and spec icons go here |
| Swatch | SWCH | No text |
| Safety and compliance | PS01–PS06 | Warnings and safety information, such as anti-tip notices for dressers |
Our Amazon image requirements guide covers the main image rules in depth. For infographics, the rules for images in general are more important. No image on Amazon may show:
- customer reviews, five-star imagery or claims such as “free shipping”;
- seller-specific information;
- Amazon logos, trademarks or anything confusingly similar;
- badges such as “Amazon’s Choice” or “Best seller”.
Every image must also accurately show the product in the listing and match its title. A call-out for a feature the product does not have is a compliance issue, not just a returns issue.
Amazon recommends at least 6 additional images and 1 video. Use 2 or 3 of those slots for infographics, not all of them, as customers still need other angles, a lifestyle scene and close-ups. Images need at least 500 px on the longest side, and 1,000 px or more turns on zoom. For an infographic with small text, aim for 2,000 px or more.
Brand owners can add A+ Content below the image gallery, with comparison charts and feature modules that have more room for detail. Based on its internal data, Amazon says Basic A+ Content can increase sales by up to 8%, and well-made Premium A+ Content by up to 20%. A cutaway with a dozen labels fits better there than in a gallery slot.
Walmart and Your Own Store
Walmart’s image guidelines are very similar to Amazon’s, but the restrictions on wording are stricter. The main image must have a seamless white background, without watermarks, names or logos. No image may include claims or promotional language, other retailers’ names or logos, or text in a language other than English. Walmart recommends at least 4 images per listing, all square, at 2,200 x 2,200 px.
In practice, “soft-close doors” is a feature and is acceptable on both platforms. However, “the best desk you’ll ever own” is promotional and is not acceptable on either. A square master image of 2,200 px matches Walmart’s recommended size. It is also far above Amazon’s zoom threshold, so 1 file can be used for both platforms.
On your own website, there are no rules on image slots. Infographics can be larger and more detailed there, and the same image can be used in a feature block next to the product description.
How to Design an Amazon Infographic That Reads on a Phone
Most infographics fail on a phone, not on the designer’s monitor. Baymard’s testing has shown that text in images may become unreadable once the image shrinks on mobile devices. For this reason, it recommends large call-outs, similar in size to titles. These rules keep a product infographic readable and compliant:
- One message per image. Features in one, dimensions in another, layers in a third. A shopper swiping through the gallery gets one idea per swipe.
- Three to five callouts. Any more and the labels shrink to fit. If a product has ten selling points, make two images.
- Headline-sized type. Check the image at phone width before you approve it. If you have to zoom to read a label, it’s too small.
- Point at the real part. A leader line should end on the hinge, not near it. Parts too small to see at full size get a magnified circle.
- Plan empty space in the shot. Labels need room. In a render, the camera and the product can be placed to leave a clean column for text, which beats squeezing labels over a busy background.
- Write features, not slogans. “16-gauge steel base” can be checked. “Rock-solid” can’t, and on Walmart it counts as promotional language.
- Back every claim. Fire-resistant, waterproof, low-VOC or organic should rest on a test result or a certificate you can show.
- Give dimensions in both units. Inches for US shoppers, centimeters for everyone else, with height, width and depth on the same image.
- Keep one style across the catalog. The same font, colors, icon set and line weight on every product make the listings read as one brand.
- Keep text on separate layers. Specs get updated, and selling in another country means another language. A layered file lets you change the words without redoing the image.
Why Build Product Infographics From 3D Renders
An infographic is only as good as the image under it, and the images infographics need most are often the hardest to photograph. It is not possible to show the inside of a mattress without cutting it open, and a recliner cutaway means cutting through a finished chair. With a 3D model, the product can be opened as many times as required without damage.
| Photo-based infographic | 3D render-based infographic | |
|---|---|---|
| Layers and cutaways | A cut sample or a separate illustration | Rendered from the same model |
| Space for labels | Fixed by the shot | Camera framed around the layout |
| Color and finish variants | A reshoot or a Photoshop recolor | Materials swapped, same angle and callouts |
| Product not made yet | Not possible | Possible from CAD files or drawings |
| Spec change | A new shoot | The model edited and re-rendered |
| Reuse | The photo only | Silo, lifestyle, exploded views and GLB files from one model |
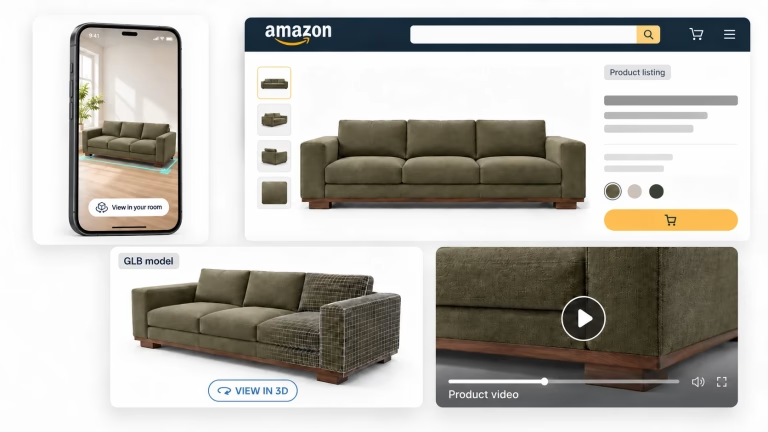
The last row is the most important one on Amazon. The model behind your infographics also gives you the main image, lifestyle scenes and a GLB file for Amazon’s 3D view. For AirScent, we created the full Amazon image set this way: silos for the main image, then lifestyle scenes, close-ups and infographic-style images for the additional slots. To see where infographics fit among the other images in a listing, read our breakdown of Amazon product images for furniture.
How We Make Product Infographics
Every infographic we create starts from an accurate 3D model, and the graphics are added only after the render is right:
- Brief. You tell us which selling points matter and which marketplaces the images are for.
- Shot plan. We agree on the format for each feature: callouts on white, a room scene, a layer view or a cutaway.
- Model. Our artists build the product from CAD files, drawings or photos, including the inner parts a cutaway will show.
- Materials and render. Fabrics, woods and finishes are matched to your samples, and the camera leaves room for the labels.
- Callouts. Lines, labels and icons are added in your fonts and colors, sized to read on a phone.
- Delivery. JPEG, PNG or TIFF at the sizes each marketplace asks for, with a layered PSD on request.
At volume (200+ items a year), feature views and infographic renders start at $30 per image, and 3D models start at $60. If we have already modeled the product, no new model is needed.
What to Send Us
- CAD files, drawings or photos of the product from several sides, plus anything inside it that a cutaway should show.
- The features, materials and certifications to highlight, with the test results or certificates behind them.
- Your brand fonts, colors and icon style, or an existing infographic you like.
- The marketplaces you sell on and any notes from their category style guides.
Need infographics for an entire catalog? See formats, examples and prices for product feature rendering services, and send us a list of your products.

Get product infographics that sell
Feature callouts, layer views and spec infographics rendered from one 3D model, in your brand style and ready for Amazon.
See feature rendersFAQ
What is a product infographic?
It is a product image with call-outs, icons, dimensions or brief text added to highlight features that a picture alone cannot show. On marketplaces, product infographics appear in the additional image slots after the main image.
Can an Amazon main image be an infographic?
No. The main image must have a pure white background and only show the product with its included accessories, with no text, logos or graphics. Infographics go in the additional image slots (PT01 to PT99).
What should an Amazon infographic include?
Use one message and 3 to 5 short feature labels pointing to the real parts. Make sure the text is large enough to read on a phone. Do not include reviews, star ratings, promotional claims such as “free shipping” or any Amazon logos or badges.
What size should an Amazon infographic be?
At least 1,000 px on the longest side, so zoom works. If there is a lot of text in the image, use 2,000 px or more to keep the labels sharp. A 2,200 px square file also meets Walmart’s recommendation.
Can you make product infographics without a photoshoot?
Yes. A 3D artist can create a 3D model from CAD files, drawings or photos. From this model, every view, cutaway and color can be rendered, and the call-outs are added on top.